How It Works
Results shown, whether from simulated or live accounts, are not typical and do not guarantee future performance. See our full Risk Disclaimer.
Low Float. High Relative Volume. A Real Reason to Move.
Every stock Raider Trading is designed to trade has to clear three filters at once: a small floating share count, unusually high volume relative to its own normal average, and a news catalyst that explains why today is different from any other day. None of these alone is enough. Together, they create a genuine supply and demand imbalance, rare, sharp, and, for a short window, genuinely tradeable.
Float is the number of shares actually available to trade, not total shares outstanding, but the portion not locked up by insiders, institutions, or restrictions. When float is small and buying pressure shows up, there simply aren't enough shares to absorb it calmly. Price has to move to find sellers. That's not a pattern being followed; it's basic supply and demand under pressure.
Relative volume confirms that pressure is real and happening right now, not a stale setup from last week. And the news catalyst is the "why": the actual reason new attention is showing up on this stock today.
- Small share count means real order flow moves price directly, with no deep bench of supply to absorb it
- Price action is driven by the crowd reacting to the same news catalyst, together, in real time
- Technical levels like breakouts, dips, and highs of day tend to hold real meaning, since retail order flow dominates the tape
- Volatility is elevated but explainable: there's a specific, identifiable reason today is different
- Enormous float absorbs even very large orders without producing much of a ripple in price
- Price action is dominated by institutional algorithms and high-frequency trading desks, not by visible catalysts
- Classic technical levels are noisier and considerably less reliable on an intraday basis
- Even genuinely "big" news is often already priced in long before you have a chance to react to it
This is why the strategy deliberately avoids mega-caps. It's not that big, stable companies are bad investments. They're just the wrong instrument for what this system is built to do, which is read short-term supply and demand, not long-term value.
What the Scanner Is Actually Measuring
"Low float, high volume, moving" is easy to say. Underneath it, the scanner is checking several layers of activity at once, each catching something the others would miss on their own.

Recent Volume, 15-Minute Window
How much has actually traded recently, not today's running total. A stock can carry a big daily volume number while doing nothing at all right now; this checks the current window specifically.
Weighted Volume
Raw share counts treat every stock the same, but a million shares means something very different for a $2 stock than a $50 one. Weighted volume adjusts for price, so stocks at different price points can genuinely be compared side by side instead of cheap stocks automatically dominating on volume alone.
Moving: a Live-Activity Check
A tighter, current-moment read across the last couple of one-minute bars: is price actually ranging (not just sitting flat) and is that price-adjusted volume genuinely elevated right now. This is what separates a stock that's live this minute from one that only qualifies on paper.
Proximity to High & VWAP
Where the stock is sitting right now relative to two reference points: today's session high, and today's volume-weighted average price. This is the actual mechanism behind "pulled back off highs" versus "extended near highs" in the next section, not a judgment call, a direct measurement.
Daily Relative Volume & Float
Then the slower-moving context: relative volume (today's activity against this stock's own normal average) and float (how many shares are actually available to trade). These set the stage; the faster checks above confirm it's actually happening right now.
Individually, none of these checks is unusual. Together, layered on top of each other, they're what separate a stock that merely fits the profile on paper from one that's actually behaving that way this minute.
Long and Short Start From the Same List
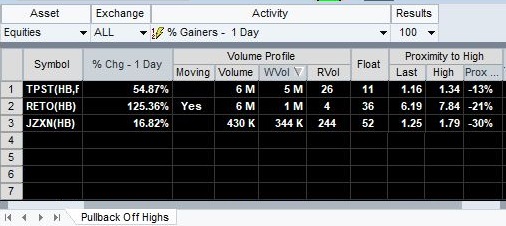
It's not that Long Mode and Short Mode hunt for fundamentally different stocks. Both scanners run the identical baseline filters, percentage change, moving, volume, weighted volume, relative volume, and float, against the same universe of stocks. The only filter that actually differs between them is where price currently sits relative to today's high.
- Same baseline filters as the Extended scanner: % change, moving, volume, weighted volume, relative volume, float
- The one difference: price is currently more than 10% below today's high
- Same baseline filters as the Pullback scanner: % change, moving, volume, weighted volume, relative volume, float
- The one difference: price is currently within 10% of today's high
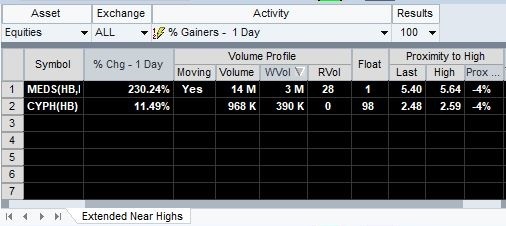
That's the entire difference: same filters, same universe of stocks, split into two views by where price happens to be right now, more than 10% off the high, or within 10% of it. A stock can move from one list to the other over the course of a session as price moves. Think of it less as two separate scanners and more as one candidate list, viewed through two different windows.
The scanner narrows the field down. Deciding whether a specific stock on it is actually worth running Long or Short on is a separate, second step, and it's the same three-part check either way, just with opposite targets:
-
1. Within the "Pullback Off Highs" scanner, look for:
- Moving (Yes, highly liquid)
- HIGH weighted volume (WVol)
- HIGH daily relative volume (RVol)
- LOW float
- 2. News: a positive, recent catalyst behind the move (check the widget's news panel) helps ensure a parabolic move can sustain itself.
- 3. Start once those line up
-
1. Within the "Extended Near Highs" scanner, look for:
- Moving (Yes, highly liquid)
- HIGH weighted volume (WVol)
- LOW daily relative volume (RVol)
- HIGH float
- 2. News & Availability: weak, old, or no catalyst behind the move (check the widget's news panel), and shares available to borrow.
- 3. Start once those line up
Neither list pre-filters for which direction relative volume or float should point, both accept any level that clears the baseline. So a stock can land on the Extended Near Highs scanner while still carrying high relative volume, low float, and a strong positive catalyst, exactly the pattern the Targeting Long checklist above is looking for, not the Short one. Shorting a stock just because it appeared on that list, without actually running the checklist, is how a short position gets run over.
The scanner and the checklist are two different steps. The scanner narrows the universe down to stocks worth a look; the checklist is what tells you whether a specific one actually fits the mode you're considering.
This describes what the software's own scanners are built to surface, and the checklist it's designed around. It isn't a recommendation about which stock or which mode to run on a given day; that decision, like the risk you set, is still yours.
One Search, Not Five Open Tabs
A stock can clear every scanner criterion and still be moving for a reason worth knowing before you commit. Rather than leaving that check to you across several news sites, Raider Trading pulls it together on the same screen.
For the ticker in front of you, it gathers recent news coverage alongside relevant SEC filings, the kind of primary disclosure (an 8-K, a share offering, an ownership change) that counts as a confirmed, tangible event on its own, not just a headline about one. If what's already on hand doesn't clearly explain why the stock is moving right now, it runs a live search to check whether something broke in just the last couple hours that the earlier sources missed.
If there's a genuine, specific catalyst, it's summarized for you. If there isn't one, it says so plainly rather than manufacturing a reason where none exists.
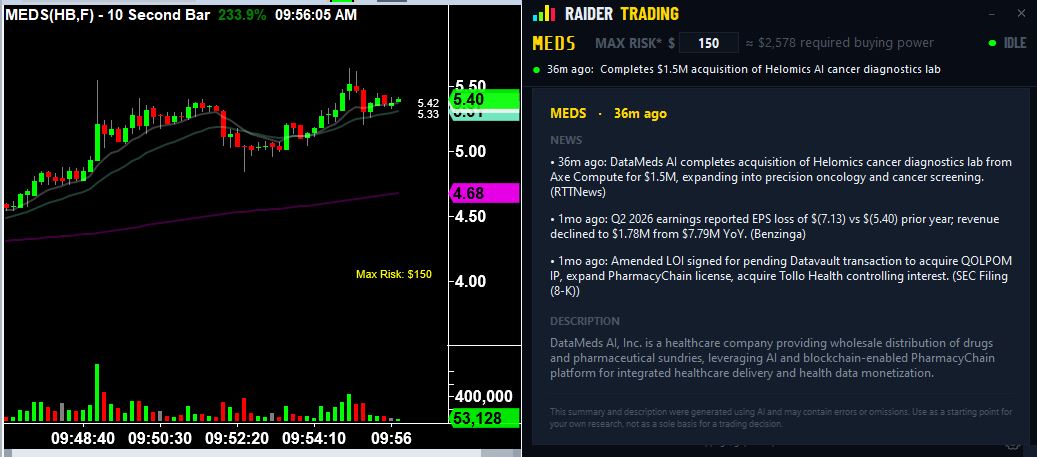
The row itself only has room for the single most recent item, so that's what it shows at a glance. Hover over it and it expands into the full picture: every distinct catalyst found, each with its own timestamp and source, plus a short description of the company itself, so you're not left wondering what the ticker even is.
That's the point of it: what you'd otherwise gather from five different tabs, distilled to what actually matters, right where you're already looking. It's information to inform your own decision, not a recommendation to act on it.
How the Position Grows and Defends Itself
Once you pick a stock, set your Max Risk, and choose Long or Short mode, the algorithm takes over the part that's genuinely hard to do by hand consistently: scaling the position as price proves (or disproves) the move, in real time.
Price confirms the move → Compound Add
As price moves further in your favor and clears each confirmation level, the position scales up aggressively, growing toward your max position size. The move is proving itself real, so the size grows to match.
Price goes against you → Double Down
If price moves the other way instead, the position also scales, but more conservatively, giving the trade more room to breathe and more forgiveness if it's a temporary pullback rather than a real reversal.
Price reverses back through cost basis → Derisk
Stocks rarely move in one straight line. When price reverses back across your average cost, the algorithm sells down part of the position. That lightens the trade and lowers your effective cost basis, so the next add or double-down has more influence, setting up a better position if the move resumes.
Max position reached → the trade resolves
If price keeps extending in your favor after the position is fully built, it converts to a Take Profit at roughly a 1:1 reward-to-risk relative to what you set. If it keeps going against you instead, it converts to a Stop Loss at approximately your Max Risk.
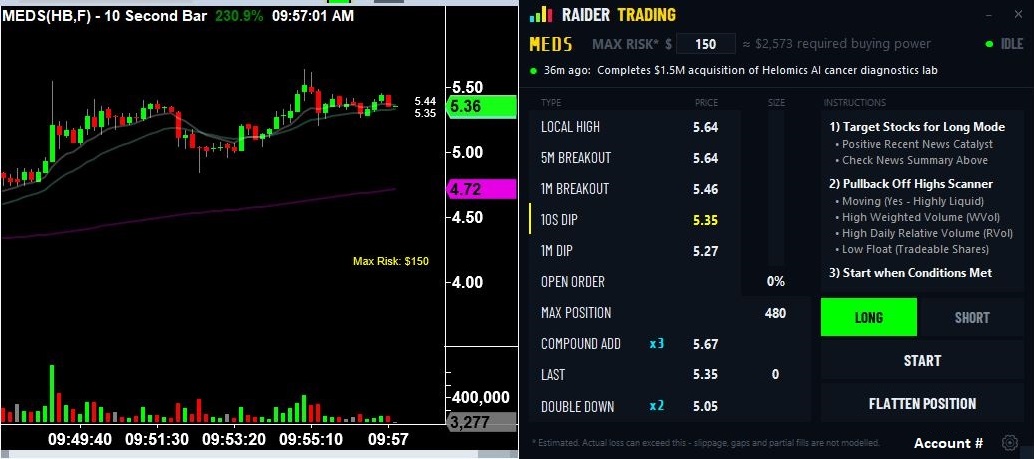
The initial breakout or dip that can start a position is one-shot: it can only fire once per run. Compound Add, Double Down, and Derisk are different. Any of them can fire multiple times over the life of a single trade, each time price genuinely earns it. That's what lets the position keep adjusting instead of following one fixed script.
None of these levels are fixed dollar amounts or flat percentages, either. Each one is set relative to the stock's own recent volatility, so a fast, wide-swinging stock gets correspondingly wider levels, and a calmer one gets tighter ones. A level sized for a stock swinging 15% a day would be meaningless applied to one moving 2%.
Say you go Long and price immediately drops. Several Double Down levels get hit, and your cost basis keeps drifting lower, but before your max loss is reached, price reverses back above your average cost. The algorithm derisks: it sells part of the position right there, locking in a lower cost basis. If the reversal keeps going and price makes a run at new highs, you're now sitting in a better spot to reach full profit than you would've been holding the original, heavier position.
This is also why Long Mode specifically favors stocks that have pulled back, rather than ones already extended in a straight line up. An already-extended stock has less room left to run and a higher chance of reversing right as you enter, so it stops out more often. A pullback within an established move gives the algorithm room to scale into strength that's more likely to continue.
Why the Position Doesn't Just Hit a Wall
Compound Add and Double Down deliberately use different multipliers: Double Down is intentionally smaller, to give a losing trade more breathing room. That's good for you, but on its own it creates a problem: if left unchecked, a full string of adds could grow the position faster than a full string of double-downs, throwing off the 1:1 risk/reward the whole system is built around.
The fix is a graduated buffer instead of a hard wall. When a scale-in would push the position past its max size, the algorithm doesn't just refuse the trade or flip straight to an exit. Instead it "tops off," adding a smaller amount to bring the position to within about 5% of the max. Only once you're already within roughly 10% of max position does the next signal genuinely fire a Sell or Cover instead. That graduated buffer is what keeps the actual risk/reward ratio close to 1:1, even though the two sides of the trade were never sized identically to begin with.
Letting a Winner Run
During regular market hours, Raider Trading doesn't cap winners with a hard limit order. It uses a stop instead, and on a fast-moving stock, price can blow straight past that stop without ever triggering it, letting the position keep running.
If that happens, there's a second mechanism watching in the background: once open profit reaches roughly double your Max Risk, it locks in the win instead of letting the trade ride indefinitely. Worst case, the runner never happens and the trade just comes back to the original stop for a normal win. Best case, you catch a move well beyond what a fixed target would have allowed.
Rounding That Works in Your Favor
When Max Risk is large enough to warrant it, order sizes are intentionally rounded to lots of 100 shares. That's not arbitrary: round-lot orders can be routed as hidden (iceberg) orders, meaning they don't show up on Level 2. That matters for two reasons: other traders can't see your size and front-run you by stepping in front of your order, and you're less likely to get left holding a partial fill because your size spooked the order book. It's a small detail, but at scale it meaningfully affects the price you actually get filled at.
The Discipline of a "Mental Stop"
Outside of regular market hours, brokers generally don't support live stop orders, TradeStation included, and it doesn't support trading at all past 8pm Eastern. Discretionary traders who trade pre-market or after-hours handle this the hard way: they set a price level in their head, watch it like a hawk, and manually exit the instant it's hit. It's a real, well-known skill, and it's genuinely difficult to execute consistently, because it requires catching your own exit in real time with zero hesitation, every single time.
That's exactly the discipline Raider Trading automates. It's watching price the entire session, extended hours included, ready to act the instant a level is hit: no hesitation, no second-guessing, no stepping away from the screen at the wrong moment. The one exception is TradeStation's hard 8pm cutoff: if a position is still open as that approaches, nothing (automated or manual) can exit it through TradeStation after that point, so flattening it yourself becomes your responsibility.
Find the Setup. Click Start. Walk Away.
Once you've picked the stock, set your risk, and chosen a mode, the rest (entries, scaling, derisking, exits) happens without you needing to watch the screen. A winning trade ends with a distinct tone; a losing one ends with another. You'll know which one just happened whether you're at your desk or across the room.
That matters because manual trading forces you to sit and stare at the chart so you don't miss your moment, and that kind of forced attention is exactly what leads to bad decisions born out of boredom, impatience, or fatigue. Removing the need to watch doesn't just save time; it removes the single biggest source of unforced errors in active trading.
To be clear: none of this claims to win every trade, or to eliminate risk. Losses still happen: that's what Max Risk is for. What this removes is the human decision-making that turns a normal, planned loss into a much bigger one. Max Risk is also a target, not a hard guarantee: slippage, gap moves, thin liquidity, and technical issues can all cause an actual loss to exceed it. See our full risk disclaimer for details.
See It on a Free Simulated Account
You can open a TradeStation account and run Raider Trading on a simulated paper-trading account. TradeStation requires the account to be funded to unlock simulated trading, but there's no minimum deposit size, so this doesn't have to mean a large commitment. Decide for yourself whether the strategy fits how you want to trade before going live.